

PTE Describe Image: Tips, Templates and Sample Answers

  • October 27, 2026
PTE Describe Image speaking practice guide

PTE Describe Image is an important task in the PTE Academic Speaking section. It tests your ability to understand visual information and explain the main ideas clearly in spoken English. You may need to describe a bar chart, line graph, pie chart, table, map, process diagram, or another type of image.

To perform well, you need to identify the main idea, select the most important details, and speak fluently within the available time. You do not need to describe every detail in the image. Instead, focus on accurate information, logical organisation, and clear pronunciation.

In this guide, you will learn how to answer PTE Describe Image questions, use a flexible speaking structure, describe different types of visuals, and practise with sample answers.

What Is PTE Describe Image?

PTE Describe Image is a speaking task in which you look at a visual and explain the information it presents. The image may contain numerical data, comparisons, geographical information, stages of a process, or relationships between different elements.

According to Pearson’s current PTE Academic guidance, you have 25 seconds to study the image and prepare your response, followed by 40 seconds to speak. Your response is assessed on content, oral fluency, and pronunciation. Official Pearson guidance.

The aim is to communicate the most important information accurately and naturally rather than simply listing labels or reading numbers aloud.

PTE Describe Image: Task Format

Task feature Details
Test section Speaking
Preparation time 25 seconds
Response time 40 seconds
Main task Describe the information shown in an image
Common visual types Bar charts, line graphs, pie charts, tables, maps and process diagrams
Skills assessed Content, oral fluency and pronunciation

Always check the official PTE test-format information for the latest instructions.

How Is PTE Describe Image Scored?

Your response should demonstrate that you can understand the visual, explain its main information, and communicate your ideas clearly.

1. Content

Content refers to how accurately and thoroughly you describe the image. A strong response identifies the main idea and supports it with relevant details.

For example, if a bar chart compares sales across three products, you could mention the highest value, the lowest value, and the overall comparison.

2. Oral Fluency

Oral fluency refers to how smoothly and naturally you speak. Avoid unnecessary pauses, repeated words, long hesitations, and frequent restarts.

You do not need to speak extremely fast. A steady pace with clear connections between ideas is more useful than rushing through the answer.

3. Pronunciation

Pronunciation refers to how clearly you produce spoken English. Pay attention to word endings, sentence stress, and number pronunciation.

Practise speaking in complete phrases rather than saying individual words or figures separately.

For additional speaking guidance, read our PTE Speaking guide.

How to Describe an Image in PTE: Step-by-Step Strategy

A simple structure can help you organise your response under time pressure. Use your preparation time to identify the main information rather than memorising a complete answer.

Step 1: Identify the Main Topic

First, look at the title or heading of the image. It often tells you what the visual is about.

For example, the image might compare product sales, show population changes, explain a manufacturing process, or present the results of a survey.

Ask yourself:

  • What is the image about?
  • What information does it present?
  • Is it showing a comparison, a trend, a distribution, or a sequence?

Step 2: Find the Most Important Details

Next, identify two or three details that help explain the image.

For a chart, look for the highest and lowest values, significant differences, or noticeable trends. For a process diagram, identify the starting point, main stages, and final outcome.

You do not need to mention every label or number. Select details that help the listener understand the overall message.

Step 3: Organise Your Response

Arrange your ideas in a logical order:

  1. Introduce the image and its topic.
  2. Describe the main feature or overall trend.
  3. Mention two or three relevant details.
  4. Finish with a summary if time allows.

This structure helps your response sound organised rather than like a list of disconnected observations.

Step 4: Speak Clearly and Naturally

When the recording begins, start speaking promptly. Use complete sentences and connect your ideas with phrases such as “in comparison,” “while,” “whereas,” and “overall.”

Avoid unnecessary repetition or long pauses while searching for complex vocabulary. Simple, accurate English is sufficient when it communicates the information clearly.

Step 5: Finish Before the Recording Ends

You have up to 40 seconds to respond. Practise giving a complete description within that time without rushing at the end.

If you finish your main points early, add a relevant comparison or summary. Do not invent information just to fill the remaining time.

PTE Describe Image Template

A flexible template can help you organise your ideas, but it should not replace your understanding of the image. Adapt your wording and details to the actual visual.

General Describe Image Structure

You can organise your response using this pattern:

Introduction: “The image illustrates…”

Main feature: “The most noticeable feature is…”

Supporting details: “In particular, … while …”

Comparison or trend: “Compared with …, …”

Conclusion: “Overall, the image shows…”

Example of an Adaptable Template

“The image illustrates [main topic]. The most noticeable feature is [main trend or key information]. In particular, [important detail one], while [important detail two]. Another significant point is [additional comparison or feature]. Overall, the image highlights [main conclusion supported by the visual].”

Use only the parts that fit the image. A process diagram may need a description of stages rather than a comparison, while a line graph may require you to explain changes over time.

Important: Do not memorise one complete response and repeat it for every question. Pearson warns against memorised responses because they may fail to address the actual image and can affect content scoring. Your description should be relevant to the visual in front of you.

PTE Describe Image Examples With Sample Answers

Practising different visual types helps you become comfortable identifying information quickly. The following examples demonstrate how to describe common images using relevant details and clear sentences.

Example 1: PTE Describe Image Bar Chart

PTE Describe Image bar chart practice example

Practice Example: Product Sales

Imagine a bar chart showing the following sales figures for three products.

Product Sales
Product A 25
Product B 45
Product C 70

The figures above are illustrative practice data.

Sample Answer

“The bar chart compares sales figures for three different products. Product C records the highest value at 70, followed by Product B at 45. Product A has the lowest figure, with sales of 25. The difference between Product C and Product A is 45, showing a clear gap between the highest and lowest values. Overall, Product C performs best among the three products, while Product A has the lowest sales figure.”

Why This Answer Works

  • It introduces the chart and its subject.
  • It identifies the highest and lowest values.
  • It includes relevant numbers from the visual.
  • It compares the products clearly.
  • It ends with a concise summary.

Tips for Bar Charts

When describing a bar chart, focus on comparisons rather than listing every bar individually.

Useful expressions include:

  • “The highest figure is…”
  • “The lowest value is recorded for…”
  • “X is higher than Y.”
  • “There is a noticeable difference between…”
  • “Overall, the chart indicates…”

Always check the labels and units before interpreting the numbers. Do not describe a value as a percentage unless the chart uses percentages.

Example 2: PTE Describe Image Line Graph

A line graph usually shows how a value changes over time. Your response should explain the general trend and identify significant increases, decreases, or stable periods.

Imagine a line graph showing the number of visitors to a website over four months.

Month Visitors
January 200
February 300
March 450
April 400

The figures above are illustrative practice data.

Sample Answer

“The line graph shows changes in website visitors from January to April. The number of visitors increases from 200 in January to 300 in February and reaches a peak of 450 in March. However, the figure then declines slightly to 400 in April. Despite this decrease at the end of the period, the overall trend is upward. In summary, website traffic generally grows between January and April, with March recording the highest number of visitors.”

Tips for Line Graphs

Pay attention to the direction and size of changes.

Useful vocabulary includes:

  • Increase: rise, grow, climb
  • Decrease: fall, decline, drop
  • No major change: remain stable, stay constant
  • High point: reach a peak
  • Comparison: compared with, whereas, in contrast

Use words such as “slightly,” “steadily,” or “sharply” only when the visual supports that description.

Example 3: PTE Describe Image Pie Chart

A pie chart presents the proportions of a whole. The main task is to identify the largest and smallest segments and explain how the categories compare.

Imagine a pie chart showing how a group of students travel to college.

Transport method Percentage
Bus 40%
Car 30%
Bicycle 20%
Walking 10%

The figures above are illustrative practice data.

Sample Answer

“The pie chart illustrates the transport methods used by students to travel to college. Bus travel represents the largest share at 40%, followed by cars at 30%. Bicycle use accounts for 20%, while walking represents the smallest proportion at 10%. Together, bus and car travel make up 70% of the total. Overall, the chart indicates that public and private motorised transport account for most of the journeys in this example.”

Tips for Pie Charts

For a pie chart, focus on proportions and comparisons.

Useful phrases include:

  • “The largest proportion is…”
  • “X accounts for…”
  • “This is followed by…”
  • “The smallest segment represents…”
  • “Together, these categories make up…”

Make sure your percentages and comparisons are accurate. Do not add interpretations about why people choose a particular option unless the image provides that information.

Example 4: PTE Describe Image Process Diagram
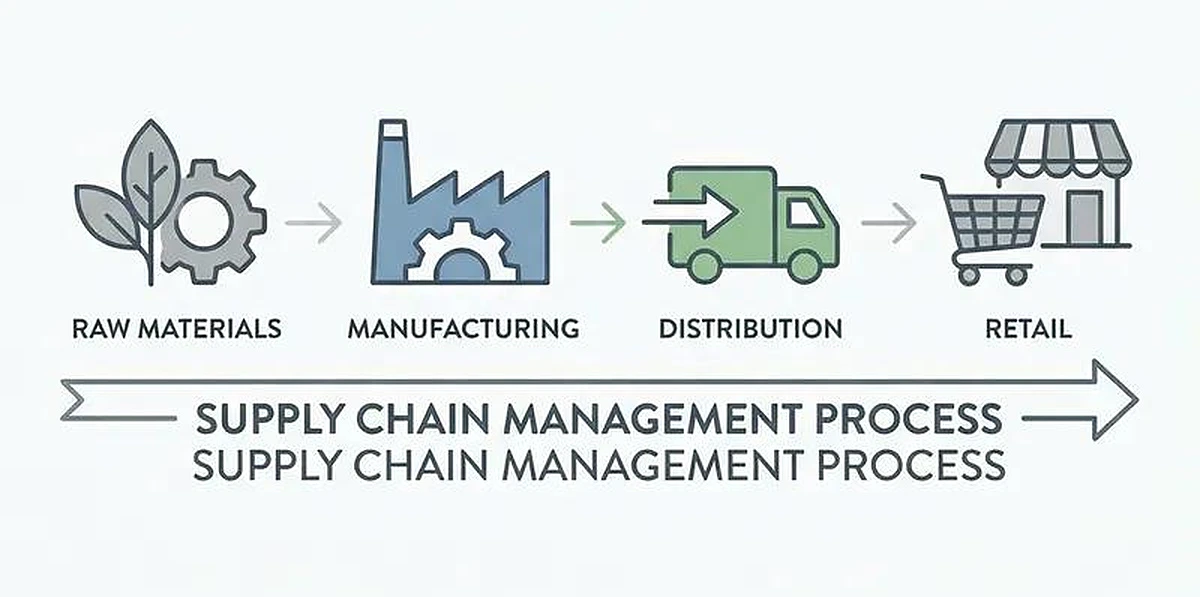
PTE Describe Image process diagram practice

Suggested diagram content if you are creating the image in WordPress or with a designer: A simple horizontal flow diagram showing four stages: Collect Raw Materials → Process Materials → Manufacture Product → Package and Distribute. Use a white background, light-blue stage boxes and dark-blue arrows, consistent with PTEHub’s visual style.

Practice Example: Manufacturing Process

Imagine a process diagram showing how a product is manufactured, from collecting raw materials to distributing the finished product.

Sample Answer

“The diagram illustrates a four-stage manufacturing process, beginning with the collection of raw materials. In the second stage, these materials are processed and prepared for production. The processed materials are then used to manufacture the product. Finally, the finished product is packaged and distributed. Overall, the diagram presents a sequence of connected stages that transform raw materials into a product ready for delivery.”

Tips for Process Diagrams

When describing a process, follow the sequence shown in the diagram.

Useful expressions include:

  • “The process begins with…”
  • “The next stage involves…”
  • “Following this…”
  • “Once this stage is complete…”
  • “The final stage is…”
  • “Overall, the diagram shows how…”

Do not force a comparison-based template onto a process diagram. Describe the stages in their actual order and avoid adding steps that are not shown.

Example 5: PTE Describe Image Table

A table may present information across several categories, locations, age groups or time periods. Your task is to identify the main comparison and select the most useful figures.

Imagine a table comparing the number of books read by three students in one month.

Student Books read
Alex 8
Mia 12
Noah 6

The figures above are illustrative practice data.

Sample Answer

“The table compares the number of books read by three students in one month. Mia reads the highest number, with 12 books, followed by Alex with 8. Noah reads the fewest books, with a total of 6. The difference between Mia and Noah is six books. Overall, Mia reads the most books in this comparison, while Noah records the lowest figure.”

Tips for Tables

  • Identify what the rows and columns represent.
  • Select the highest and lowest values.
  • Mention important differences or similarities.
  • Include units when relevant.
  • Avoid reading every cell aloud if it does not help explain the main information.

Example 6: PTE Describe Image Map

A map may show locations, geographical features, distribution patterns or changes between places. Focus on the areas or features that are most important.

Sample Answer Structure

“The map illustrates the distribution of [main subject] across [location or region]. The most noticeable feature is [main geographical pattern]. In particular, [first important location or feature] is shown in [area], whereas [second feature] appears in [another area]. The map also indicates [additional relevant detail]. Overall, the image highlights how [main subject] is distributed across the region.”

Tips for Maps

  • Identify the location or subject shown.
  • Notice where features are concentrated or absent.
  • Use directional terms only when supported by the map.
  • Compare areas if the map makes a clear comparison.
  • Avoid inventing geographical explanations.

How to Use Your 25 Seconds of Preparation Time

Preparation time is short, so use a simple scanning method instead of trying to understand every detail.

A Quick Preparation Plan

First 5 seconds: Identify the topic.

Read the title and look at the labels, axes or main elements.

Next 10 seconds: Find the key information.

Identify the main trend, highest and lowest values, major stages or important geographical features.

Final 10 seconds: Organise your response.

Choose an opening sentence, two or three supporting details, and a short conclusion if appropriate.

You can make brief notes using keywords or numbers where permitted. Avoid writing full sentences because there may not be enough time to read them and speak naturally.

Common PTE Describe Image Mistakes to Avoid

Even when you understand the image, a poorly organised response can make your description less effective.

1. Describing Every Detail

Trying to mention every number, label, and feature can make your answer confusing.

What to do instead: Select the main idea and two or three supporting details.

2. Using the Same Memorised Answer for Every Image

A generic answer may not explain the specific information shown.

What to do instead: Use a flexible structure but adapt the content to the actual visual.

3. Ignoring the Main Trend

Listing numbers without explaining what they show can make your answer sound disconnected.

What to do instead: Explain the relationship between the figures. For example, say that one category is higher than another or that a trend increases over time.

4. Speaking Too Fast

Rushing may reduce clarity and lead to pronunciation mistakes.

What to do instead: Practise speaking at a natural, steady pace. Focus on clear sentences and smooth transitions.

5. Repeating Words or Restarting Sentences

Frequent repetition and corrections can interrupt the flow of your response.

What to do instead: Plan a few keywords before speaking. If you make a small mistake, continue rather than restarting the whole answer.

6. Inventing Information

Adding unsupported explanations can make your answer inaccurate.

What to do instead: Describe what the visual actually shows. If the reason for a trend is not provided, do not guess.

7. Ending Without a Clear Main Point

A response that contains isolated observations may not communicate the overall message.

What to do instead: Start with the topic and explain the most important pattern. Finish with a summary when time allows.

For more advice on improving your practice routine, read our guide to common PTE mock test mistakes.

How to Practise PTE Describe Image Effectively

Regular practice helps you identify important information faster and speak more confidently under timed conditions.

Practise Different Image Types

Do not practise only bar charts. Include line graphs, pie charts, tables, maps, and process diagrams so you become familiar with different visual formats.

Record and Review Your Answers

Record your response and listen to it afterwards. Ask yourself:

  • Did I identify the main topic correctly?
  • Did I mention relevant details from the image?
  • Was my answer logically organised?
  • Did I speak at a steady pace?
  • Were my words and numbers easy to understand?
  • Did I avoid unsupported claims and unnecessary repetition?

Choose one or two areas to improve in each practice session rather than trying to correct everything at once.

Practise Under Timed Conditions

Use 25 seconds to prepare and up to 40 seconds to speak. Practising with the actual time limits helps you develop a realistic response structure.

Use Feedback to Identify Weaknesses

Feedback can help you identify problems with fluency, pronunciation, organisation, and relevance. Review the feedback alongside the original image to check whether your answer accurately describes the information.

You can use PTE practice online to build a regular practice routine and explore our PTE practice tests for additional preparation.

For structured study resources, explore our PTE preparation materials. If you prefer guided preparation, you can also learn more about the PTE online course.

Conclusion

PTE Describe Image becomes easier when you follow a consistent approach: identify the topic, select the main information, support it with relevant details, and speak clearly in a logical order.

Practise a range of visuals rather than relying on one template. Use your preparation time to plan a few key points, avoid unsupported information, and review your recordings to identify areas for improvement.

Frequently Asked Questions About PTE Describe Image

1. How much time do you get for PTE Describe Image?

In PTE Academic, you have 25 seconds to study the image and prepare your response, followed by 40 seconds to speak. Check Pearson’s official test-format page for current instructions.

2. How do you answer PTE Describe Image questions?

Identify the topic, select the main trend or feature, mention two or three relevant details and organise them into complete sentences. Finish with a short summary if time allows.

3. Is a template useful for PTE Describe Image?

Yes. A flexible structure can help you organise your response under time pressure. However, you must adapt it to the image rather than repeat a memorised answer that does not describe the visual accurately.

4. What should I describe first in a chart?

Start by identifying the chart’s topic. Then describe the main trend, comparison or pattern before adding supporting details such as the highest and lowest values.

5. Do I need to mention every number in the image?

No. Focus on the figures that best explain the main information. Mentioning too many numbers can make your response difficult to follow.

6. How can I improve my fluency in Describe Image?

Practise with different visuals, prepare a few keywords before speaking, and record your answers. Review unnecessary pauses, repeated words, and sentence restarts, then practise again.

7. Can I use the same Describe Image template for every question?

You can use the same general structure, but the details must change according to the image. Charts often require comparisons, while process diagrams usually require you to explain stages in sequence.

8. What should I do if I do not understand the image completely?

Focus on the information you can identify confidently. Describe the title, main pattern and a few clear details instead of inventing information or guessing at unsupported explanations.

9. How can I practise PTE Describe Image at home?

Use practice images, follow the 25-second preparation and 40-second response limits, and record your answers. Review content, fluency, and pronunciation after each attempt. You can also use online practice tests and structured preparation materials.

10. Does Describe Image affect my PTE Speaking score?

Yes. Describe Image is a scored speaking task in PTE Academic. Pearson identifies content, oral fluency, and pronunciation as the main scoring dimensions for this task.


Practice on the PTEHub App

Prepare anywhere, anytime with real exam-like questions, instant AI scoring, and detailed performance insights directly on your mobile device.

PTEHub Mobile App

You May Also Like

Understanding how PTE scoring works can help you prepare more effectively, set realistic score targets, and identify areas that need...
Are you getting a lower PTE Speaking score than expected, even after hours of practice? You may be speaking too...
  If your PTE Speaking score is not improving despite regular practice, you might be wondering what you are doing...
  PTE Repeat Sentence Practice is an essential part of preparing for the PTE Academic exam. In this task, you...

Tags:

Share:

PTE Describe Image speaking practice guide

PTE Describe Image is an important task in the PTE Academic Speaking section. It tests your ability to understand visual information and explain the main ideas clearly in spoken English. You may need to describe a bar chart, line graph, pie chart, table, map, process diagram, or another type of image.

To perform well, you need to identify the main idea, select the most important details, and speak fluently within the available time. You do not need to describe every detail in the image. Instead, focus on accurate information, logical organisation, and clear pronunciation.

In this guide, you will learn how to answer PTE Describe Image questions, use a flexible speaking structure, describe different types of visuals, and practise with sample answers.

What Is PTE Describe Image?

PTE Describe Image is a speaking task in which you look at a visual and explain the information it presents. The image may contain numerical data, comparisons, geographical information, stages of a process, or relationships between different elements.

According to Pearson’s current PTE Academic guidance, you have 25 seconds to study the image and prepare your response, followed by 40 seconds to speak. Your response is assessed on content, oral fluency, and pronunciation. Official Pearson guidance.

The aim is to communicate the most important information accurately and naturally rather than simply listing labels or reading numbers aloud.

PTE Describe Image: Task Format

Task feature Details
Test section Speaking
Preparation time 25 seconds
Response time 40 seconds
Main task Describe the information shown in an image
Common visual types Bar charts, line graphs, pie charts, tables, maps and process diagrams
Skills assessed Content, oral fluency and pronunciation

Always check the official PTE test-format information for the latest instructions.

How Is PTE Describe Image Scored?

Your response should demonstrate that you can understand the visual, explain its main information, and communicate your ideas clearly.

1. Content

Content refers to how accurately and thoroughly you describe the image. A strong response identifies the main idea and supports it with relevant details.

For example, if a bar chart compares sales across three products, you could mention the highest value, the lowest value, and the overall comparison.

2. Oral Fluency

Oral fluency refers to how smoothly and naturally you speak. Avoid unnecessary pauses, repeated words, long hesitations, and frequent restarts.

You do not need to speak extremely fast. A steady pace with clear connections between ideas is more useful than rushing through the answer.

3. Pronunciation

Pronunciation refers to how clearly you produce spoken English. Pay attention to word endings, sentence stress, and number pronunciation.

Practise speaking in complete phrases rather than saying individual words or figures separately.

For additional speaking guidance, read our PTE Speaking guide.

How to Describe an Image in PTE: Step-by-Step Strategy

A simple structure can help you organise your response under time pressure. Use your preparation time to identify the main information rather than memorising a complete answer.

Step 1: Identify the Main Topic

First, look at the title or heading of the image. It often tells you what the visual is about.

For example, the image might compare product sales, show population changes, explain a manufacturing process, or present the results of a survey.

Ask yourself:

  • What is the image about?
  • What information does it present?
  • Is it showing a comparison, a trend, a distribution, or a sequence?

Step 2: Find the Most Important Details

Next, identify two or three details that help explain the image.

For a chart, look for the highest and lowest values, significant differences, or noticeable trends. For a process diagram, identify the starting point, main stages, and final outcome.

You do not need to mention every label or number. Select details that help the listener understand the overall message.

Step 3: Organise Your Response

Arrange your ideas in a logical order:

  1. Introduce the image and its topic.
  2. Describe the main feature or overall trend.
  3. Mention two or three relevant details.
  4. Finish with a summary if time allows.

This structure helps your response sound organised rather than like a list of disconnected observations.

Step 4: Speak Clearly and Naturally

When the recording begins, start speaking promptly. Use complete sentences and connect your ideas with phrases such as “in comparison,” “while,” “whereas,” and “overall.”

Avoid unnecessary repetition or long pauses while searching for complex vocabulary. Simple, accurate English is sufficient when it communicates the information clearly.

Step 5: Finish Before the Recording Ends

You have up to 40 seconds to respond. Practise giving a complete description within that time without rushing at the end.

If you finish your main points early, add a relevant comparison or summary. Do not invent information just to fill the remaining time.

PTE Describe Image Template

A flexible template can help you organise your ideas, but it should not replace your understanding of the image. Adapt your wording and details to the actual visual.

General Describe Image Structure

You can organise your response using this pattern:

Introduction: “The image illustrates…”

Main feature: “The most noticeable feature is…”

Supporting details: “In particular, … while …”

Comparison or trend: “Compared with …, …”

Conclusion: “Overall, the image shows…”

Example of an Adaptable Template

“The image illustrates [main topic]. The most noticeable feature is [main trend or key information]. In particular, [important detail one], while [important detail two]. Another significant point is [additional comparison or feature]. Overall, the image highlights [main conclusion supported by the visual].”

Use only the parts that fit the image. A process diagram may need a description of stages rather than a comparison, while a line graph may require you to explain changes over time.

Important: Do not memorise one complete response and repeat it for every question. Pearson warns against memorised responses because they may fail to address the actual image and can affect content scoring. Your description should be relevant to the visual in front of you.

PTE Describe Image Examples With Sample Answers

Practising different visual types helps you become comfortable identifying information quickly. The following examples demonstrate how to describe common images using relevant details and clear sentences.

Example 1: PTE Describe Image Bar Chart

PTE Describe Image bar chart practice example

Practice Example: Product Sales

Imagine a bar chart showing the following sales figures for three products.

Product Sales
Product A 25
Product B 45
Product C 70

The figures above are illustrative practice data.

Sample Answer

“The bar chart compares sales figures for three different products. Product C records the highest value at 70, followed by Product B at 45. Product A has the lowest figure, with sales of 25. The difference between Product C and Product A is 45, showing a clear gap between the highest and lowest values. Overall, Product C performs best among the three products, while Product A has the lowest sales figure.”

Why This Answer Works

  • It introduces the chart and its subject.
  • It identifies the highest and lowest values.
  • It includes relevant numbers from the visual.
  • It compares the products clearly.
  • It ends with a concise summary.

Tips for Bar Charts

When describing a bar chart, focus on comparisons rather than listing every bar individually.

Useful expressions include:

  • “The highest figure is…”
  • “The lowest value is recorded for…”
  • “X is higher than Y.”
  • “There is a noticeable difference between…”
  • “Overall, the chart indicates…”

Always check the labels and units before interpreting the numbers. Do not describe a value as a percentage unless the chart uses percentages.

Example 2: PTE Describe Image Line Graph

A line graph usually shows how a value changes over time. Your response should explain the general trend and identify significant increases, decreases, or stable periods.

Imagine a line graph showing the number of visitors to a website over four months.

Month Visitors
January 200
February 300
March 450
April 400

The figures above are illustrative practice data.

Sample Answer

“The line graph shows changes in website visitors from January to April. The number of visitors increases from 200 in January to 300 in February and reaches a peak of 450 in March. However, the figure then declines slightly to 400 in April. Despite this decrease at the end of the period, the overall trend is upward. In summary, website traffic generally grows between January and April, with March recording the highest number of visitors.”

Tips for Line Graphs

Pay attention to the direction and size of changes.

Useful vocabulary includes:

  • Increase: rise, grow, climb
  • Decrease: fall, decline, drop
  • No major change: remain stable, stay constant
  • High point: reach a peak
  • Comparison: compared with, whereas, in contrast

Use words such as “slightly,” “steadily,” or “sharply” only when the visual supports that description.

Example 3: PTE Describe Image Pie Chart

A pie chart presents the proportions of a whole. The main task is to identify the largest and smallest segments and explain how the categories compare.

Imagine a pie chart showing how a group of students travel to college.

Transport method Percentage
Bus 40%
Car 30%
Bicycle 20%
Walking 10%

The figures above are illustrative practice data.

Sample Answer

“The pie chart illustrates the transport methods used by students to travel to college. Bus travel represents the largest share at 40%, followed by cars at 30%. Bicycle use accounts for 20%, while walking represents the smallest proportion at 10%. Together, bus and car travel make up 70% of the total. Overall, the chart indicates that public and private motorised transport account for most of the journeys in this example.”

Tips for Pie Charts

For a pie chart, focus on proportions and comparisons.

Useful phrases include:

  • “The largest proportion is…”
  • “X accounts for…”
  • “This is followed by…”
  • “The smallest segment represents…”
  • “Together, these categories make up…”

Make sure your percentages and comparisons are accurate. Do not add interpretations about why people choose a particular option unless the image provides that information.

Example 4: PTE Describe Image Process Diagram

PTE Describe Image process diagram practice

Suggested diagram content if you are creating the image in WordPress or with a designer: A simple horizontal flow diagram showing four stages: Collect Raw Materials → Process Materials → Manufacture Product → Package and Distribute. Use a white background, light-blue stage boxes and dark-blue arrows, consistent with PTEHub’s visual style.

Practice Example: Manufacturing Process

Imagine a process diagram showing how a product is manufactured, from collecting raw materials to distributing the finished product.

Sample Answer

“The diagram illustrates a four-stage manufacturing process, beginning with the collection of raw materials. In the second stage, these materials are processed and prepared for production. The processed materials are then used to manufacture the product. Finally, the finished product is packaged and distributed. Overall, the diagram presents a sequence of connected stages that transform raw materials into a product ready for delivery.”

Tips for Process Diagrams

When describing a process, follow the sequence shown in the diagram.

Useful expressions include:

  • “The process begins with…”
  • “The next stage involves…”
  • “Following this…”
  • “Once this stage is complete…”
  • “The final stage is…”
  • “Overall, the diagram shows how…”

Do not force a comparison-based template onto a process diagram. Describe the stages in their actual order and avoid adding steps that are not shown.

Example 5: PTE Describe Image Table

A table may present information across several categories, locations, age groups or time periods. Your task is to identify the main comparison and select the most useful figures.

Imagine a table comparing the number of books read by three students in one month.

Student Books read
Alex 8
Mia 12
Noah 6

The figures above are illustrative practice data.

Sample Answer

“The table compares the number of books read by three students in one month. Mia reads the highest number, with 12 books, followed by Alex with 8. Noah reads the fewest books, with a total of 6. The difference between Mia and Noah is six books. Overall, Mia reads the most books in this comparison, while Noah records the lowest figure.”

Tips for Tables

  • Identify what the rows and columns represent.
  • Select the highest and lowest values.
  • Mention important differences or similarities.
  • Include units when relevant.
  • Avoid reading every cell aloud if it does not help explain the main information.

Example 6: PTE Describe Image Map

A map may show locations, geographical features, distribution patterns or changes between places. Focus on the areas or features that are most important.

Sample Answer Structure

“The map illustrates the distribution of [main subject] across [location or region]. The most noticeable feature is [main geographical pattern]. In particular, [first important location or feature] is shown in [area], whereas [second feature] appears in [another area]. The map also indicates [additional relevant detail]. Overall, the image highlights how [main subject] is distributed across the region.”

Tips for Maps

  • Identify the location or subject shown.
  • Notice where features are concentrated or absent.
  • Use directional terms only when supported by the map.
  • Compare areas if the map makes a clear comparison.
  • Avoid inventing geographical explanations.

How to Use Your 25 Seconds of Preparation Time

Preparation time is short, so use a simple scanning method instead of trying to understand every detail.

A Quick Preparation Plan

First 5 seconds: Identify the topic.

Read the title and look at the labels, axes or main elements.

Next 10 seconds: Find the key information.

Identify the main trend, highest and lowest values, major stages or important geographical features.

Final 10 seconds: Organise your response.

Choose an opening sentence, two or three supporting details, and a short conclusion if appropriate.

You can make brief notes using keywords or numbers where permitted. Avoid writing full sentences because there may not be enough time to read them and speak naturally.

Common PTE Describe Image Mistakes to Avoid

Even when you understand the image, a poorly organised response can make your description less effective.

1. Describing Every Detail

Trying to mention every number, label, and feature can make your answer confusing.

What to do instead: Select the main idea and two or three supporting details.

2. Using the Same Memorised Answer for Every Image

A generic answer may not explain the specific information shown.

What to do instead: Use a flexible structure but adapt the content to the actual visual.

3. Ignoring the Main Trend

Listing numbers without explaining what they show can make your answer sound disconnected.

What to do instead: Explain the relationship between the figures. For example, say that one category is higher than another or that a trend increases over time.

4. Speaking Too Fast

Rushing may reduce clarity and lead to pronunciation mistakes.

What to do instead: Practise speaking at a natural, steady pace. Focus on clear sentences and smooth transitions.

5. Repeating Words or Restarting Sentences

Frequent repetition and corrections can interrupt the flow of your response.

What to do instead: Plan a few keywords before speaking. If you make a small mistake, continue rather than restarting the whole answer.

6. Inventing Information

Adding unsupported explanations can make your answer inaccurate.

What to do instead: Describe what the visual actually shows. If the reason for a trend is not provided, do not guess.

7. Ending Without a Clear Main Point

A response that contains isolated observations may not communicate the overall message.

What to do instead: Start with the topic and explain the most important pattern. Finish with a summary when time allows.

For more advice on improving your practice routine, read our guide to common PTE mock test mistakes.

How to Practise PTE Describe Image Effectively

Regular practice helps you identify important information faster and speak more confidently under timed conditions.

Practise Different Image Types

Do not practise only bar charts. Include line graphs, pie charts, tables, maps, and process diagrams so you become familiar with different visual formats.

Record and Review Your Answers

Record your response and listen to it afterwards. Ask yourself:

  • Did I identify the main topic correctly?
  • Did I mention relevant details from the image?
  • Was my answer logically organised?
  • Did I speak at a steady pace?
  • Were my words and numbers easy to understand?
  • Did I avoid unsupported claims and unnecessary repetition?

Choose one or two areas to improve in each practice session rather than trying to correct everything at once.

Practise Under Timed Conditions

Use 25 seconds to prepare and up to 40 seconds to speak. Practising with the actual time limits helps you develop a realistic response structure.

Use Feedback to Identify Weaknesses

Feedback can help you identify problems with fluency, pronunciation, organisation, and relevance. Review the feedback alongside the original image to check whether your answer accurately describes the information.

You can use PTE practice online to build a regular practice routine and explore our PTE practice tests for additional preparation.

For structured study resources, explore our PTE preparation materials. If you prefer guided preparation, you can also learn more about the PTE online course.

Conclusion

PTE Describe Image becomes easier when you follow a consistent approach: identify the topic, select the main information, support it with relevant details, and speak clearly in a logical order.

Practise a range of visuals rather than relying on one template. Use your preparation time to plan a few key points, avoid unsupported information, and review your recordings to identify areas for improvement.

Frequently Asked Questions About PTE Describe Image

1. How much time do you get for PTE Describe Image?

In PTE Academic, you have 25 seconds to study the image and prepare your response, followed by 40 seconds to speak. Check Pearson’s official test-format page for current instructions.

2. How do you answer PTE Describe Image questions?

Identify the topic, select the main trend or feature, mention two or three relevant details and organise them into complete sentences. Finish with a short summary if time allows.

3. Is a template useful for PTE Describe Image?

Yes. A flexible structure can help you organise your response under time pressure. However, you must adapt it to the image rather than repeat a memorised answer that does not describe the visual accurately.

4. What should I describe first in a chart?

Start by identifying the chart’s topic. Then describe the main trend, comparison or pattern before adding supporting details such as the highest and lowest values.

5. Do I need to mention every number in the image?

No. Focus on the figures that best explain the main information. Mentioning too many numbers can make your response difficult to follow.

6. How can I improve my fluency in Describe Image?

Practise with different visuals, prepare a few keywords before speaking, and record your answers. Review unnecessary pauses, repeated words, and sentence restarts, then practise again.

7. Can I use the same Describe Image template for every question?

You can use the same general structure, but the details must change according to the image. Charts often require comparisons, while process diagrams usually require you to explain stages in sequence.

8. What should I do if I do not understand the image completely?

Focus on the information you can identify confidently. Describe the title, main pattern and a few clear details instead of inventing information or guessing at unsupported explanations.

9. How can I practise PTE Describe Image at home?

Use practice images, follow the 25-second preparation and 40-second response limits, and record your answers. Review content, fluency, and pronunciation after each attempt. You can also use online practice tests and structured preparation materials.

10. Does Describe Image affect my PTE Speaking score?

Yes. Describe Image is a scored speaking task in PTE Academic. Pearson identifies content, oral fluency, and pronunciation as the main scoring dimensions for this task.

Tags:

Share:

Leave A Reply

Your email address will not be published. Required fields are marked *